
Q2 2025 Areto Hate Speech Index: Transphobia Reaches Index Record. Plus Abuse Targeting Women’s Sports Doubled this Quarter.
Q2 2025 Analysis

Transphobia smashes Index record, and that’s not a good thing. Plus abuse targeting women’s sports doubled this quarter.
Online hate is rising: fast, focused and platform-driven.
April 1 to June 30, 2025 revealed extreme spikes in specific communities and abuse types, especially around:
The Areto Hate Speech Index hit 164 in Q2 2025,(up 4% QoQ and 56% YoY)
A 314-point Women’s Sports Index (nearly double QoQ, and +150% YoY)
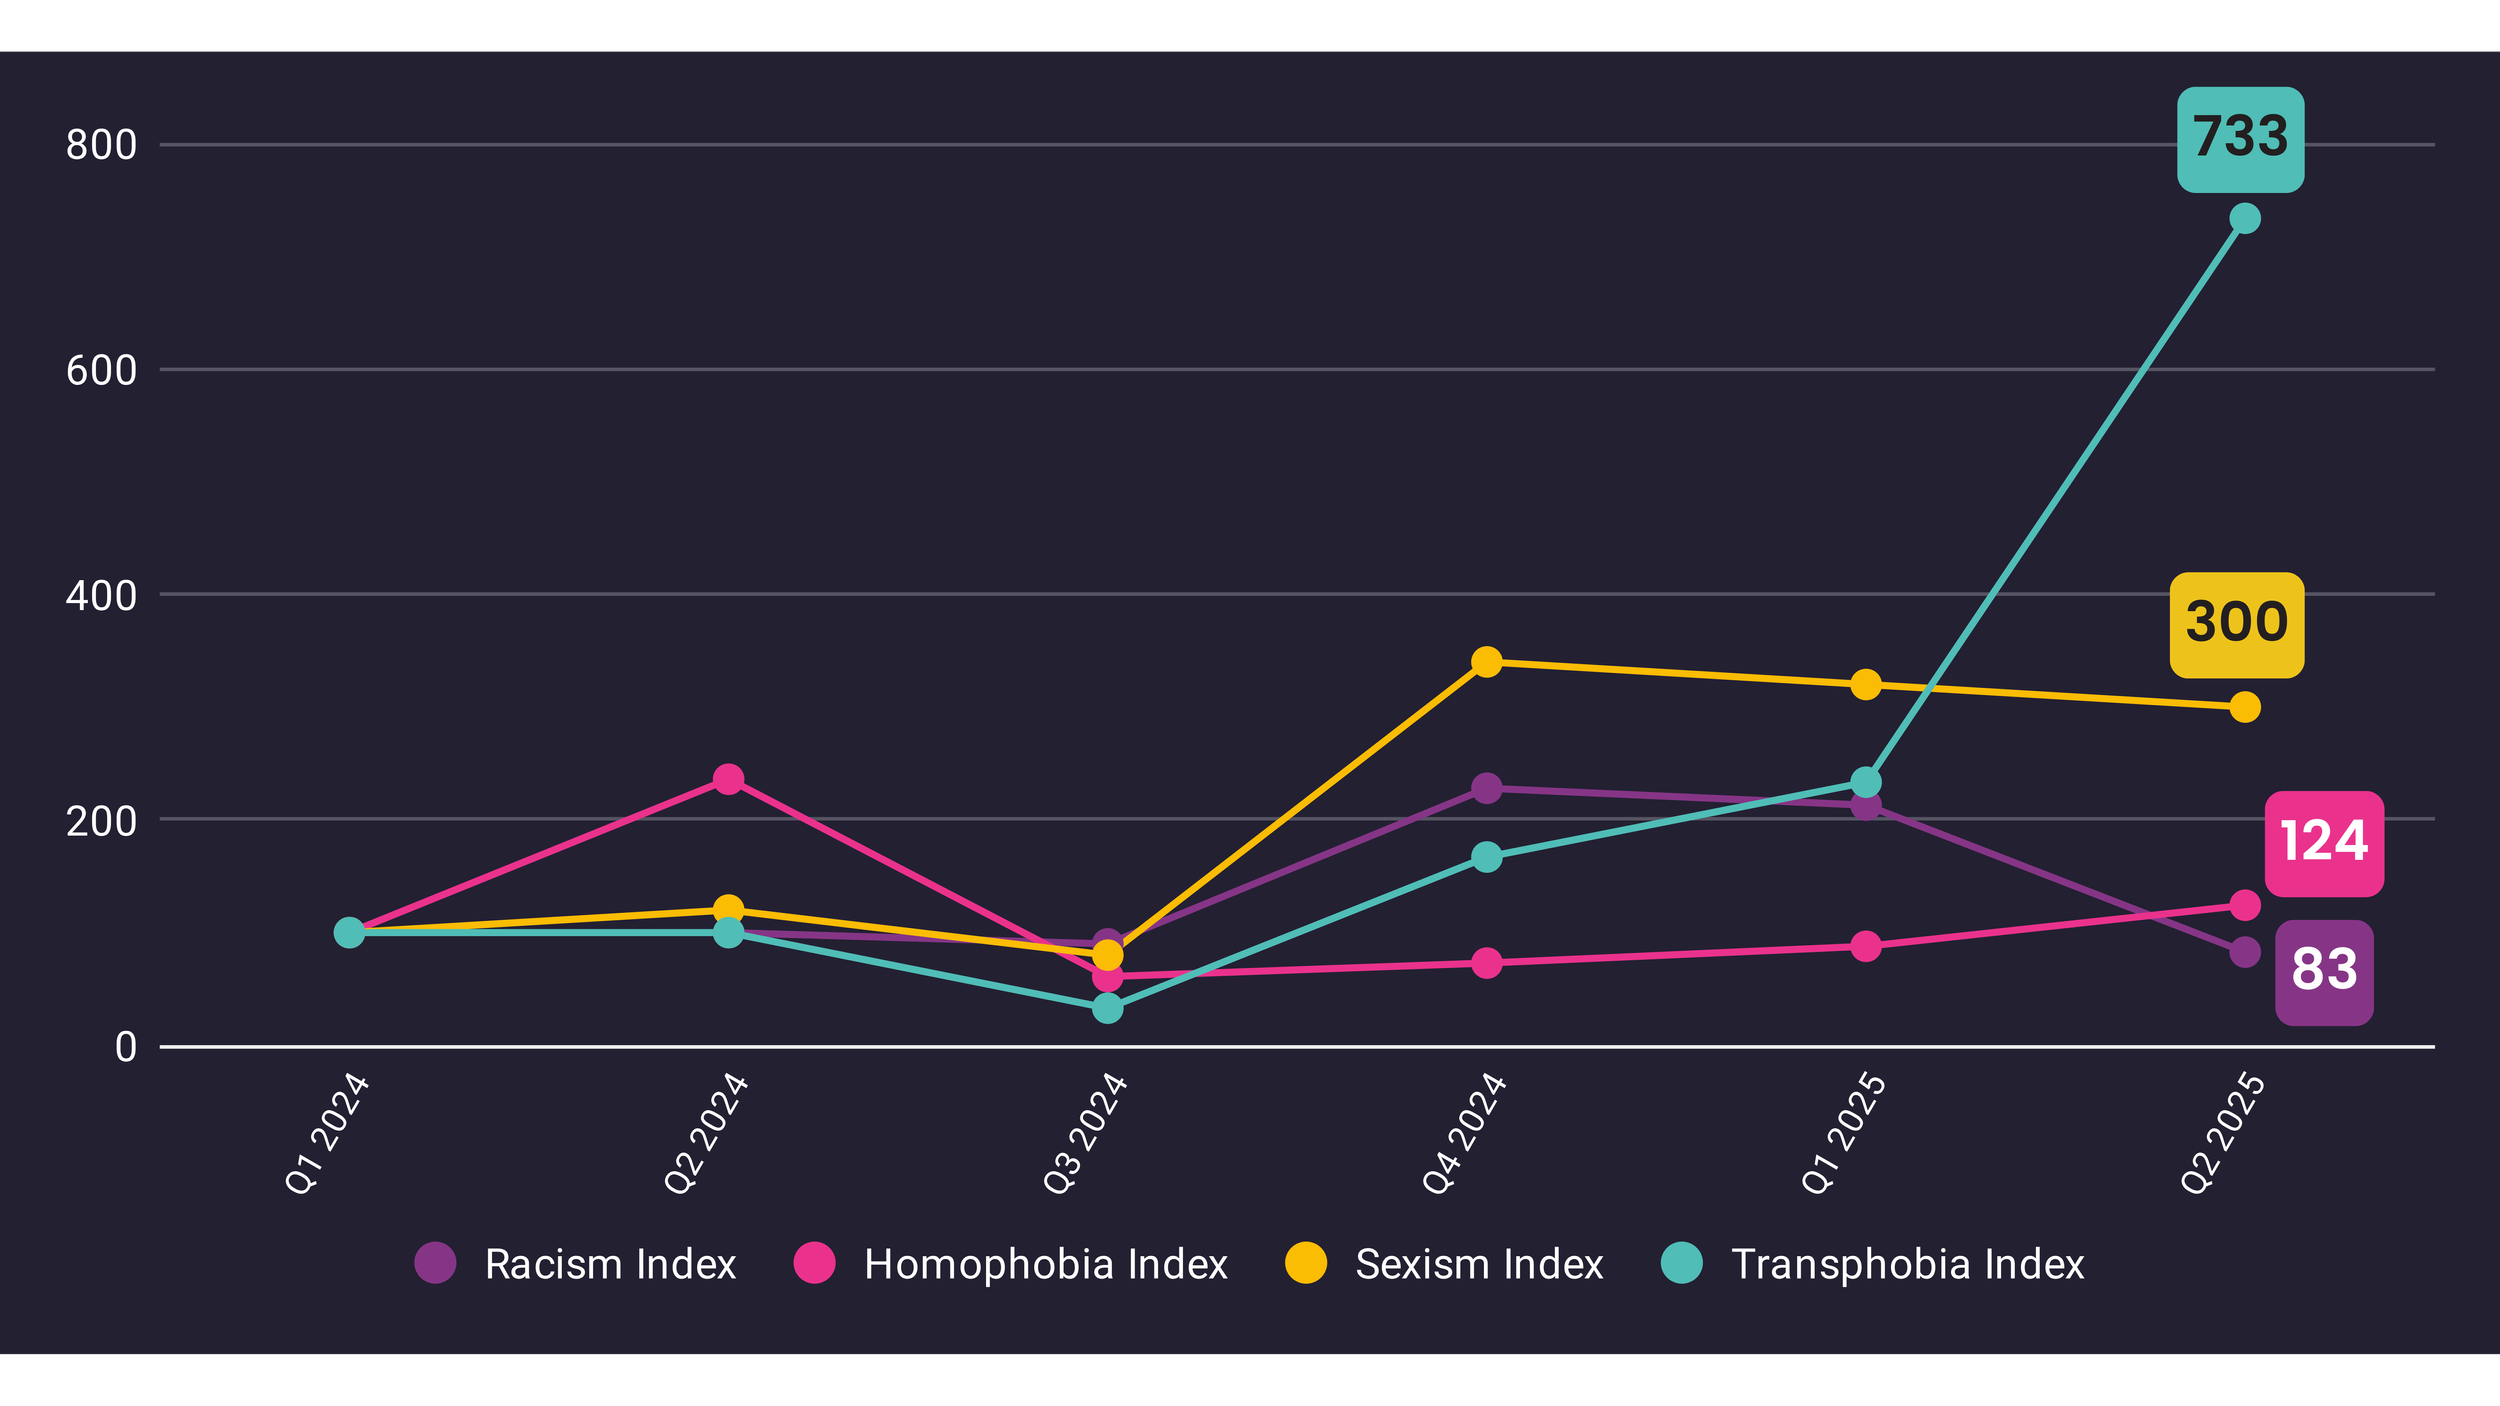
Transphobia Index reached 733 (the highest single-category score in Index history)
Facebook emerged as the largest source of transphobic content this quarter, particularly during Trans Day of Visibility and Pride Month
Q2 2025 Index Overview
| Category | Q2 2025 Index | QoQ Change | YoY Change |
|---|---|---|---|
| General | 164 | +4% | +56% |
| Transphobia | 733 | +215% | +633% |
| Homophobia | 124 | +41% | –47% |
| Sexism | 300 | –6% | +150% |
| Racism | 83 | –61% | –17% |
| Women’s Sports | 314 | +88% | +21% |
| Men’s Sports | 149 | +2% | –2% |
What the Areto Hate Speech Index Is Telling Us
The Areto Hate Speech Index continued its upward trend in Q2 2025, reaching 164 (+4% QoQ and +56% YoY). This growth reflects sustained increases in online abuse across several categories, with particularly sharp rises in transphobia, homophobia and abuse targeting women’s sports.
While the data does not isolate causes, spikes were observed around major events and periods of heightened visibility, where factors like inclusion efforts, and increased fan engagement including betting, may contribute to volatility. The trend points to a digital environment where identity-based abuse is becoming more frequent and more concentrated.
The Areto Hate Speech Index is continuing to trend upwards at 164 (+4% rise compared to Q1 2025, and +56% increase YoY), pointing to a broader normalization of online abuse in sports.
Abuse in women’s sports is climbing again—not only due to sexism, which still ranks second for abuse types on the Index, but also due to a dramatic surge in transphobia. Both forms of abuse now stand far above all others, suggesting deeper systemic issues driven by visibility, betting pressures, and LGBTQ+ backlash.
Transphobia is now the most extreme and fastest-growing form of abuse on social media for sports, with Facebook at the epicenter.
Pride Month and Trans Day of Visibility continue to trigger major spikes in hate, showing how backlash is often most intense around visibility and inclusion efforts.
Transphobia Index: Record-Setting Growth
In Q2, the Transphobia Index reached 733 (+215% QoQ and +633% YoY), the highest level ever recorded across all Indices. This isn’t a blip. It’s the highest single-category score ever captured by our Index.
This explosive growth followed a predictable and troubling pattern:
Trans Day of Visibility (March 31) triggered spillover commentary well into April
Pride Month (June) — long known as a flashpoint for LGBTQ+ backlash
A global rise in anti-trans sentiment, driven by political narratives and amplified in mainstream and social media
But the story goes beyond seasonal surges. The year-over-year trend is clear:
Transphobia isn’t just spiking, it’s growing faster than any other form of abuse tracked in the Index
The data reflects a shift in digital culture: transphobia has entered the zeitgeist, amplified by mainstream political discourse, influencer commentary and platform inaction
Visibility and inclusion should make spaces safer. But instead, support for trans communities is triggering overwhelming volumes of hate
Transphobic comments on Facebook accounted for nearly 90% of all transphobia detected in Q2

Transphobia Index by Quarter
| Quarter | Index | QoQ Change (%) | YoY Change (%) |
|---|---|---|---|
| Q1 2024 | 100 | – | – |
| Q2 2024 | 100 | 0% | – |
| Q3 2024 | 33 | –67% | – |
| Q4 2024 | 167 | +406% | – |
| Q1 2025 | 233 | +40% | +133% |
| Q2 2025 | 733 | +215% | +633% |
Homophobia Amplified in the Shadow of Transphobia
Transphobia may have dominated the data this quarter, but it wasn’t the only form of identity-based abuse on the rise.
Homophobia Index hit 124 (+41% QoQ) — a sharp increase that likely reflects similar patterns of backlash tied to Pride Month and broader anti-LGBTQ+ sentiment.
This underscores the intersectional nature of online harm, where attacks on one community often coincide with—or fuel—hostility toward others.
Homophobia Index by Quarter
| Quarter | Index | QoQ Change (%) | YoY Change (%) |
|---|---|---|---|
| Q1 2024 | 100 | – | – |
| Q2 2024 | 236 | +136% | – |
| Q3 2024 | 61 | –74% | – |
| Q4 2024 | 73 | +20% | – |
| Q1 2025 | 88 | +21% | –12% |
| Q2 2025 | 124 | +41% | –47% |
Racism: A Sharp Drop, but Not Gone
After peaking last year, the Racism Index dropped to 83 (-61% QoQ). This may reflect fewer global flashpoints or major matches where national rivalries trigger racial abuse. Still, it’s worth watching: past dips have proven temporary.
Racism Index By Quarter
| Quarter | Index | QoQ Change (%) | YoY Change (%) |
|---|---|---|---|
| Q1 2024 | 100 | – | – |
| Q2 2024 | 100 | 0.0% | – |
| Q3 2024 | 90 | –10% | – |
| Q4 2024 | 228 | +153% | – |
| Q1 2025 | 213 | –7% | +113% |
| Q2 2025 | 83 | –61% | –17% |
Sign up - Quarterly Areto Hate Speech Index Newsletter

Women’s Sports: A Surge Beyond Sexism
The Women’s Sports index hit 314 in Q2 (+88% QoQ and +21% YoY), marking a dramatic—and negative—rebound after three consecutive quarters of decline.
While that previous decline had signalled progress, this quarter’s sharp rise shows just how quickly things can shift. Surprisingly, the increase wasn’t driven by sexism, which actually fell slightly in Q2.
Women’s Sports Index by Quarter
| Quarter | Index | QoQ Change (%) | YoY Change (%) |
|---|---|---|---|
| Q1 2024 | 100 | – | – |
| Q2 2024 | 260 | +160% | – |
| Q3 2024 | 233 | –10% | – |
| Q4 2024 | 201 | –14% | – |
| Q1 2025 | 167 | –17% | +67% |
| Q2 2025 | 314 | +88% | +21% |
So what’s behind the surge? Key factors include:
Increased visibility of women’s sport in Q2, including events like the WNBA season start, French Open, and PWHL playoffs
A rise in fan intensity and betting activity, especially as viewership grows and stakes increase
Spillover abuse from related categories, notably transphobia and homophobia, both of which increased sharply in Q2
Anecdotal reports from digital teams confirm this pattern: more attention brings more vitriol, creating new challenges for moderation
This surge highlights a complex landscape where growing engagement benefits the sport but also amplifies harm in new and evolving ways. Moderation strategies must adapt to keep up.
Men’s Sports: Stable but High
Men’s Sports Index rose slightly to 149 (+2% QoQ, and -2% YoY). While relatively stable, it remains above baseline and reflects steady engagement–and steady abuse–across playoff periods and high-pressure events.
Men’s Sports Index by Quarter
| Quarter | Index | QoQ Change (%) | YoY Change (%) |
|---|---|---|---|
| Q1 2024 | 100 | – | – |
| Q2 2024 | 152 | +52% | – |
| Q3 2024 | 77 | –49% | – |
| Q4 2024 | 144 | +87% | – |
| Q1 2025 | 146 | +1% | +46% |
| Q2 2025 | 149 | +2% | –2% |
Abuse targeting men’s sports is also rising, but remains lower and less volatile than in women’s sports.
About the Sexism Index
While it didn’t drive this quarter’s spike in women’s sports abuse, sexist language remains a persistent feature of online sports culture. In Q2, the Sexism Index was 300 (-6% QoQ, +150% YoY).
Sexism is still one of the most common ways people express hostility in sport, a sign of how deeply these attitudes are woven into the digital conversation.
Sexism Index by Quarter
| Quarter | Index | QoQ Change (%) | YoY Change (%) |
|---|---|---|---|
| Q1 2024 | 100 | – | – |
| Q2 2024 | 120 | +20% | – |
| Q3 2024 | 80 | –33% | – |
| Q4 2024 | 340 | +325% | – |
| Q1 2025 | 320 | –6% | +220% |
| Q2 2025 | 300 | –6% | +150% |
👀 Want to know your Index score?
The Areto Hate Speech Index measures abuse. Areto Content Moderation Software stops it in its tracks.
Contact us or sign up for a free 2-week trial
Methodology
What is Hate Speech? Areto's Hate Speech Index encompasses both illegal speech (such as threats or incitement to violence) and harmful speech that, while not necessarily illegal, creates an environment where individuals feel unsafe or unwelcome—ultimately leading them to disengage or leave the digital community.
How is the Index calculated? The Areto Index measures the percentage of abusive content by dividing the total number of abusive comments by the total number of comments analyzed across all accounts. This gives us a standardized way to track the volume of harmful content relative to overall engagement.
How was the Index benchmarked? The Index is based on 10 million real-world social media comments from 44 sports leagues and club ecosystems across North America, Europe, New Zealand and Australia. This includes a wide range of teams, leagues, and governing bodies—providing a global benchmark for online abuse in sport.
While Q1 2025 abuse levels are elevated, we anticipate the Areto Hate Speech Index will continue to evolve as our detection models adapt to the shifting nature of online harm—capturing not just the scale, but the speed and volatility of abuse in real time.